Custom color scale for Plotly Boxplots
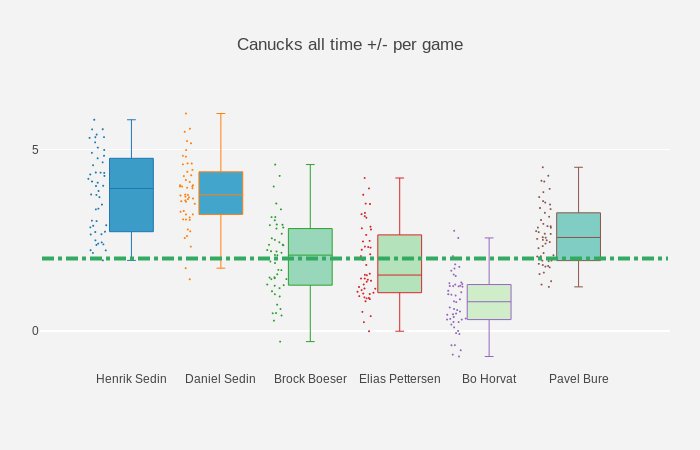
I was recently asked by my boss to apply a color scale to a series of Plotly Box plots I was working on for a Dash application. The notion was to plot multiple box plots on the same graph and have each box plot be darker or lighter based on it’s distance from the overall median in the dataset.
The issue here is that Plotly only supports color scales for heatmaps, scatter plots & contour plots. I go over the the solution I applied to this problem in this Medium blog post, enjoy!